
Carbon Sequestered and Stored in Young Versus Old Forests in the Adirondacks
May 17, 2023
Lone Profile Pine © Robert A. Leverett
By Robert T. Leverett
Cofounder, the Native Tree Society
Senior Advisor to American Forests Champion Tree Program
Coauthor, The Sierra Club Guide to Ancient Forests of the Northeast
Chair, Forest Reserves Science Advisory Committee, MA Department of Conservation and Recreation
This article was first posted in the Adirondack Council’s Blog.
INTRODUCTION
The Adirondack Park is widely recognized as an ecological treasure of global importance. It exists today, largely intact, because of its constitutional protections that have endured despite periodic and predictable efforts to weaken the protections and exploit its resources, especially the forests. The Park possesses large tracts of mature and old-growth forests. In fact, the region has the largest amount of old growth in the East, exceeding the reserves in the Great Smoky Mountains of Tennessee and North Carolina, and adjacent Pisgah and Nantahala National Forests.
With respect to the amount of Adirondack old growth, lots of estimates have been tossed around over the decades, but the work of the late Barbara McMartin and current work of Michael Kudish substantiates at least 350,000 acres of primary forest (never been logged). I’ve seen estimates as high as 500,000 acres when bogs and wetlands supporting relatively short-lived species are included. I’ve also seen estimates of 100,000 acres and less. The bogs and wetlands are primary forest, but technically, not old growth. Nonetheless, whether an area is old growth in accepted definitional terms or just primary forest, it will be carbon rich. The latest research suggests that stored amounts in primary forests may be underestimated. If this conclusion holds up, it will be of major importance.
In these times of climate change with the global warming implications, there is an important on-going debate that has spilled onto the public stage, i.e. the role of the Earth’s forests in absorbing atmospheric CO2 and storing elemental carbon in the trunks, branches, and roots of trees. Today, forests are more important in the eyes of climate scientists than they originally thought. The disparate debaters with stakes in our forests, commercial and noncommercial, do not disagree on the importance of our forests. However, there is considerable disagreement on what kinds of forests sequester carbon the most rapidly, managed versus unmanaged, young versus old. Not surprisingly, parties with financial investments in our forests advocate managed, younger woodlands as superior to unmanaged, older ones. Scientists without economic ties increasingly favor the latter. This article looks at the issue at the level of whole forests and then turns to individual trees, with direct applicability to the Adirondack forests.
CARBON STORES IN FORESTS
Our forests store carbon in living and dead plants, and carbon is incorporated in the soil. The U.S. Forest Service identifies five pools of forest carbon: soil organic, live aboveground, live belowground, deadwood, and litter. These pools are quantified in the document FOREST CARBON – An essential natural solution for climate change, written by forest researchers in UMASS Amherst and the University of Vermont. How reliable are the estimates of the contributions made by each pool? I’ll start with an example for soil organic carbon.
In FOREST CARBON, depending on forest type, soil organic carbon ranges from 31 to 51% of the total for 80-100-year old forests in the Northeast. The Ecological Society of America put out the following:
Carbon exists in many forms, predominately as plant biomass, soil organic matter, and as the gas carbon dioxide (CO2) in the atmosphere and dissolved in seawater. Carbon sequestration is the long-term storage of carbon in oceans, soils, vegetation (especially forests), and geologic formations. Although oceans store most of the Earth’s carbon, soils contain approximately 75% of the carbon pool on land — three times more than the amount stored in living plants and animals. Therefore, soils play a major role in maintaining a balanced global carbon cycle. “Benefits and Potential Costs of Management Technique,” Ecological Society of America
The 75% figure applies to grasslands, peat bogs, etc. as well as forests. However, its importance within forested lands has not always been fully appreciated.
CARBON LOSSES IN OUR FORESTS
The amount of both above and below ground organic carbon stored in any particular forest naturally oscillates over time, but decreases dramatically through human-induced disturbances and activities. We naturally understand that if a forest is cleared, for whatever reason, then much or all of its above ground carbon will be lost. Discussions about above ground losses often center on loss of forestlands to other uses, e.g. developments. However, loss also occurs in managed forests from the activity of logging. Above ground losses are visually obvious, but they occur below ground as well. This source of loss is frequently left unaddressed by those making arguments for more management.
Consider the following results from a study at the Forest Service’s distinguished Hubbard Brook Research Station in New Hampshire, Losses of mineral soil carbon largely offset biomass accumulation 15 years after whole-tree harvest in a northern hardwood forest. After sampling soils pre-harvest and in years 3, 8, and 15 following harvest, “The loss of mineral soil C offset two-thirds of the C accumulation in aboveground biomass over the same 15 years, leading to near-zero net C accumulation post-harvest, after also accounting for the decomposition of slash and roots. If this result is broadly representative, and the extent of forest harvesting is expanded to meet demand for bioenergy or to manage ecosystem carbon sequestration, then it will take substantially longer than previously assumed to offset harvest- or bioenergy-related carbon dioxide emissions with carbon uptake during forest regrowth.”
This straightforward conclusion by the Forest Service scientists will not likely be quoted by parties advocating for more logging, especially those advocating for the creation of early successional habitat, which eliminates the forest cover entirely. A recent paper entitled Forest-clearing to create early-successional habitats: Questionable benefits, significant costs by M. Kellett et al, shines a spotlight on misguided moves to increase early successional habitat. From a forest carbon perspective, it is absolutely the wrong thing to do, and it is often equally misguided in terms of its stated wildlife objectives.
Old Carbon © Robert A. Leverett
CENTRAL TO THE CARBON SEQUESTRATION DEBATE
Advocates for management, whatever the objectives, or no-management strategies often focus attention on the question of which forests sequester the most carbon, young or older woodlands. The debate isn’t which is storing more carbon, because that is clearly the older forests that have been left alone to accumulate carbon for long time periods – centuries to millennia. The question is how rapidly are older woodlands adding carbon as compared to young counterparts populated with fast-growing trees. Forest management advocates agree on this point – young forests. But the devil is in the details. The young versus old forest debate has been reduced to sound bites in the public media. If we’re going to clear the air, we need to examine the issues in much greater detail.
How young is young? How old is old? What are the tradeoffs? How are comparisons being reported? For example, we should be clear about how we define sequestration rates. Are we defining rates in terms of percentage of growth or absolute amounts of growth? Economic models in forestry often use the former, but in the carbon debates, the latter is the more relevant. It would be useful to see a carbon growth profile as a tree matures. But profiles will differ based on species, site growing conditions, and individual tree health, etc.
The remaining sections turn to the individual tree level, initially looking at an actual large white pine, tracking its biomass/carbon increase over a period of 200 years. The emphasis is on large. I acknowledge that growth trends that apply to large white pines won’t necessarily apply to other species. Nonetheless, we need to establish some baseline comparisons, and rather than generalizing, I have chosen a specific example as a step in the right direction.
THE EFFICIENCY OF LARGE TREES IN SEQUESTERING AND STORING CARBON
I often hear that young, vigorously growing forests are the most effective at sequestering carbon with the fastest growth period being up to the time of canopy closure. One can easily witness the rapid yearly growth taking place in a sapling. Young trees appear to be on steroids. Surely, they can outperform old, hulking, grandfather trees. Eventually they can, but when that happens, they will no longer be young. This point seems to be lost in the debates. We need some actual numbers to get a feel for growth along the way from young to mature to old. Let’s begin with an example.
An 8-foot tall pine sapling can easily put on up to two feet of height growth in the next year. This is a 25% increase – impressive. But in terms of the actual volume/biomass increase, it doesn’t amount to much wood. The 8-foot tall pine holds about 5 lbs of above ground biomass (excluding foliage) as calculated on my FIACOLE volume-biomass model (See Appendix II). Adding a half inch of diameter and 2 feet of height in the next year leads to a total biomass of 6.2 lbs. The gain is 1.2 lbs or 24%. High percentages such as these are often cited as proof of superior growth performance of young trees. How does the 1.2 lbs compare to biomass gain in a larger tree?
A big tree can add much more volume of wood in a year (and therefore sequester more carbon), but we don’t tend to notice it because the growth is spread over a far larger surface and volume. For instance, a 36-inch DBH, 120-foot tall white pine (about 120 years old) has 9,329 lbs of biomass, again on FIACOLE. A mere 1/8-inch increase in the radius along with a height increase of 0.67 feet leads to a total biomass of 9,511 lbs, for an increase of 182 lbs. It would take the annual growth of 152 saplings to match this annual increase.
Let’s look at the young pine when 20 years old. It may be up to 10 inches DBH and 40 feet tall. The corresponding total biomass is 250 lbs. Assuming next year’s growth to be 0.5 inches in diameter and two feet in height, the total biomass increases to 289 lbs. The increase is 39 lbs. Now, it would take the annual growth of only 5 of these young pines to match the big pine’s growth. Stated another way, the big pine is adding biomass at 5 times the rate of the 20-year-old pine. These examples illustrate how fast young trees grow and also how much wood a single big tree can add in a single season with us not even noticing.
Let’s now add 20 years and look at the young pine when 40 years old. We’ll hold the same diameter and height growth rates. The pine will hold 1,944 lbs of biomass. Continuing its fast growth at the same levels of diameter and height growth as when 20 years old, in year 41, the young pine will reach 2,092 lbs of biomass. The increase is 148 lbs. The annual growth of the young pine is catching up to the larger pine, but at this point, the big pine already holds 9,511 lbs of biomass. Its 41-year-old counterpart holds 2,092 lbs. The big pine holds as much carbon as 4.5 younger, fast-growing pines at the 40-year point. At these sizes, the big pine is three times as old as the younger pines, but it holds 4.5 times as much biomass.
What drives these biomass increases? As the pine grows larger, its greater foliage area supports more photosynthesis, which in turn adds a greater volume of new wood. So, for a period of many years, as it grows larger, it increases its biomass faster in absolute terms, and consequently, outperforms itself when it was younger in terms of the actual amounts of sequestered carbon. Eventually, the efficiency of photosynthesis slows, and at some point, decay will overtake growth. When this takes place can be determined by constantly measuring the volume of the tree and converting volume to biomass, discounting the amount by any decay to arrive at the actual amount of carbon stored above ground. The larger the tree, the more carbon it holds regardless of losses in sequestration efficiency.
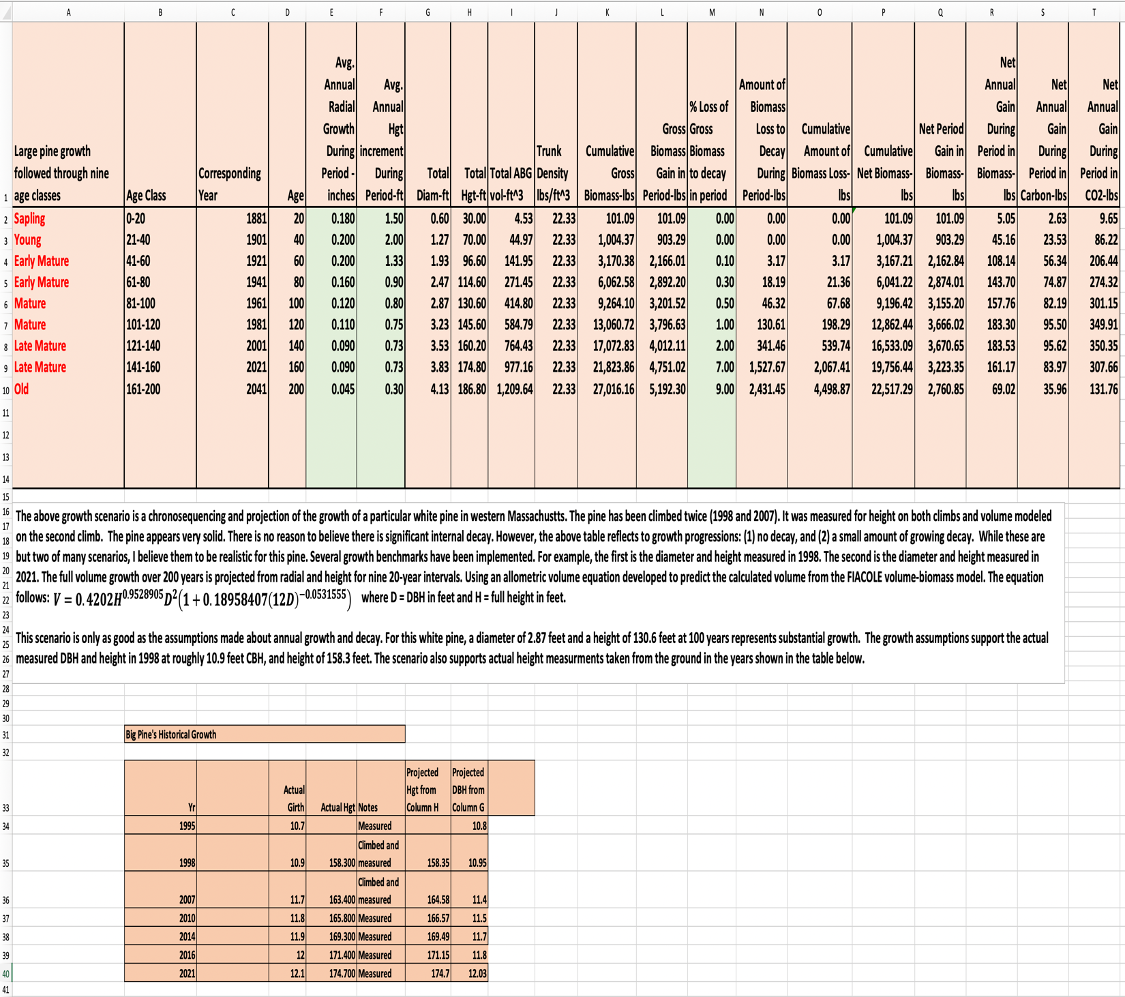
Let’s now look at an even larger pine than used in prior examples. The graph below shows the total lbs of biomass in 20-year intervals, except the last interval is at 40 years for a huge pine, now measuring 12.1 feet in circumference and 174.7 feet in height. This pine was climbed and tape-drop-measured by Will Blozan of the Native Tree Society (NTS) in 1998 and again in 2007. It grows in Mohawk Trail State Forest in western Massachusetts, and it has been measured by different members of NTS, including research forester Dr. Don Bragg of the U.S. Forest Service. Appendix I includes a table with the raw measurement data on the tree.
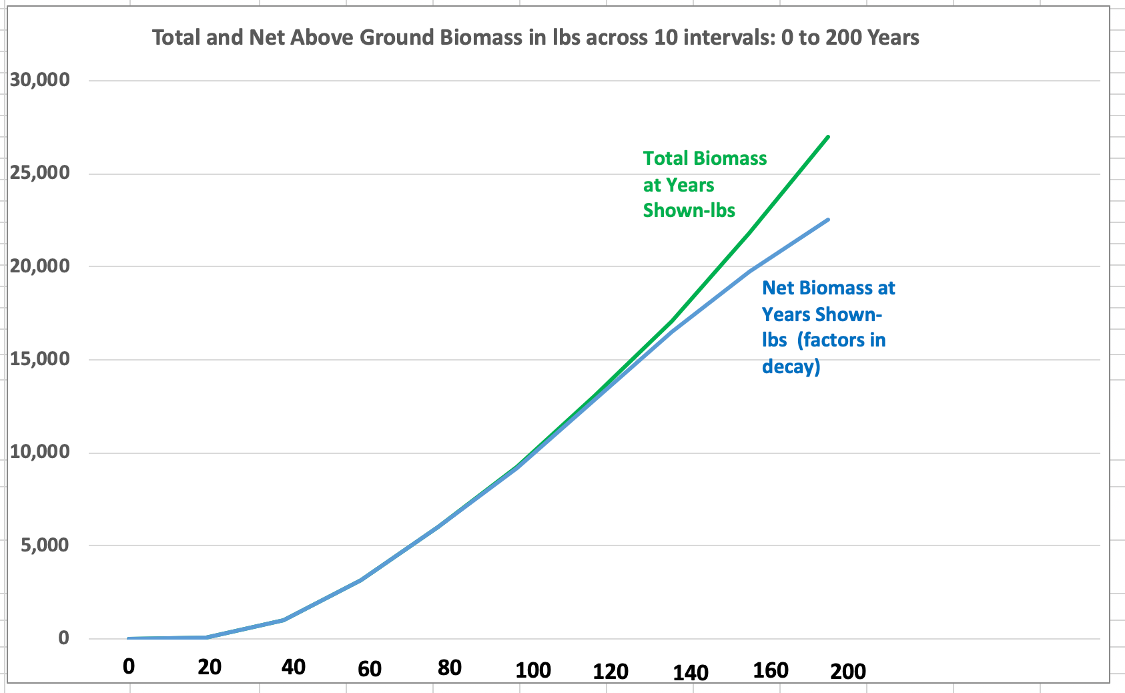
Eventually, the pine’s growth will slow down and plateau, but by then, a huge amount of biomass and carbon equivalent will have built up in its trunk, limbs, and roots. Note that the total above ground biomass is 22,308 lbs. Adding the below ground component, that amount increases to at least 25,650 lbs. While the pine appears very solid, provisions for advancing decay are included, as with the first chart. Though this pine is located in western Massachusetts, the growing conditions are similar enough to the large areas of the Adirondacks that I can safely use it as an example.
Both the previous graph and the one below summarize the large white pine’s growth in periods of 20 years, except the last period, which is 40 years.
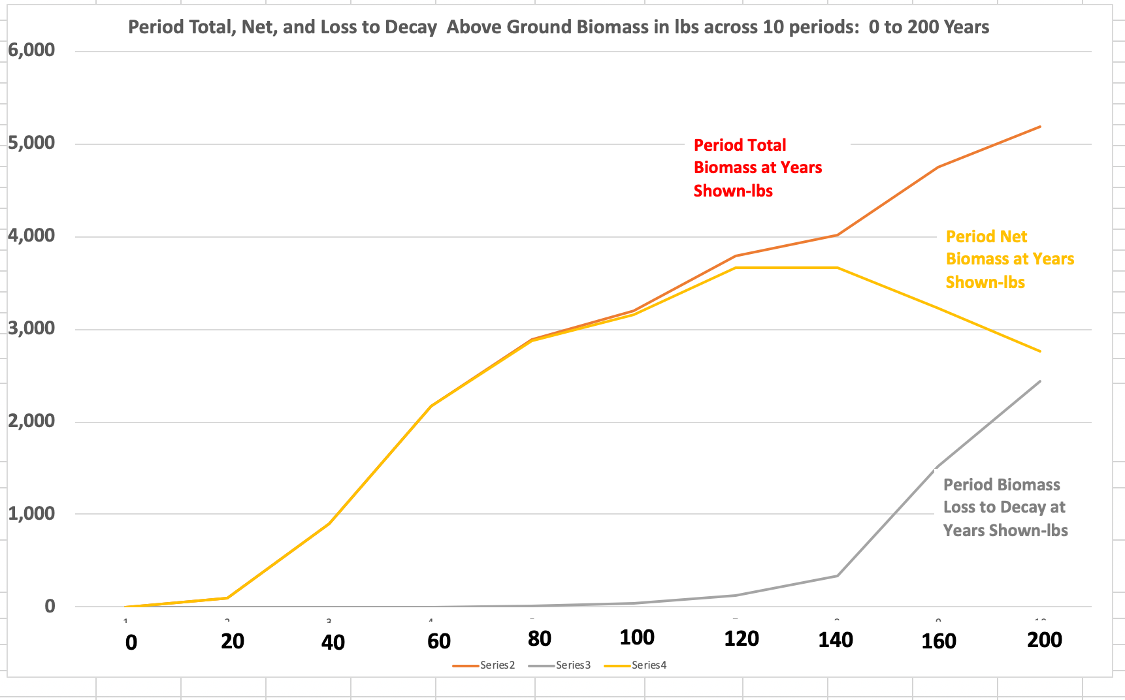
Period Total Biomass in red refers to the biomass calculated through measurement, without factoring in decay. The orange line is net period increase. The gray line tracks the period biomass loss to decay.
The lessons from this graph may be surprising. The big pine steadily gains carbon at an increasing rate up through 140 years. However, after that, between 141 and 160 years, the pine adds more carbon than it did between 41 and 60 by a factor of 1.5, even with advancing decay. Past 140 years, period gains start to drop, but at 200 years, the gain is only slightly under the gain from 61 to 80 years.
In this scenario, at 200 years, decay loss represents 13% of gross biomass. Increasing the decay to 17% of total gross accumulation, the 20-year increase from 140 to 160 years still slightly exceeds that from 80 to 100 years, which again is above all prior 20-year periods. What is evident from the graph is that 20-year biomass gains don’t become significant until 40 to 60 years. Growth in early years is rapid, percentage-wise, but it starts out from seed. The actual annual amount of carbon increase is small in the early years. It is easy to confuse percentage increases with absolute amounts. It is the latter that is important in climate mitigation.
I acknowledge that the above trends apply to a large pine. At the least, it supports the value of big trees.
FROM INDIVIDUAL TREES TO STAND LEVEL
Young forest advocates are quick to point out that while a large, dominant tree may sequester more carbon than a younger tree, lots of thickly packed young trees can outperform a few widely spaced, larger ones. But the devil is in the details. There are two factors to consider: (1) how much carbon has already been stored at a point in time, (2) what is the rate of gain at that point. To see how the different variables interact with one another, I developed a stand growth model for white pine that utilized my experience with measuring white pines of all ages over a 30-year period. Six tree size classes were adopted and their growth was projected over ten 20-year periods. Stand density was based on how many pines of each size class and associated crown area projected to the ground would cover an acre. Large diameter trees have wider crowns. Annual radial and height growth were projected for each period for each size class. The distribution of size classes for each 20-year period called on observations and measurements made from many white pine sites.
Applying this model, I concluded that at the stand level for white pine, the period of greatest live above ground biomass increase occurs between 40 and 80 years. I passed this range among forester friends here in the Northeast and got agreement. Also, a new paper out by scientists from the Woodwell Climate Research Center and elsewhere concluded that the greatest biomass increase at the stand level across many forest types averages from 35 to 75 years. These are not identical statistics but point to the age interval when stand growth peaks.
However, on my white pine model, stand growth at 80 to 120 years outpaces 0 to 40, and 120 to 140 outpaces 0 to 20. These growth intervals do not include younger trees that begin to grow back as the stand gains age and self-thins. Growth of other species filling for white pines that have died increases with time. So, young trees are present in a redeveloping stand. However, after a complete harvest, the soils will bleed CO2 for years. It will take 15 to 20 years before the carbon added from new growth will exceed that still being lost from the logging operation. The continued loss of soil organic carbon was confirmed in the US Forest Service study conducted at their Hubbard Brook Research Station in New Hampshire previously mentioned. Furthermore, as time goes on, carbon on the forest floor and in the soils builds up. As a consequence, total carbon stocks in mature and older forests are at a maximum.
THE BEST STRATEGY GOING FORWARD
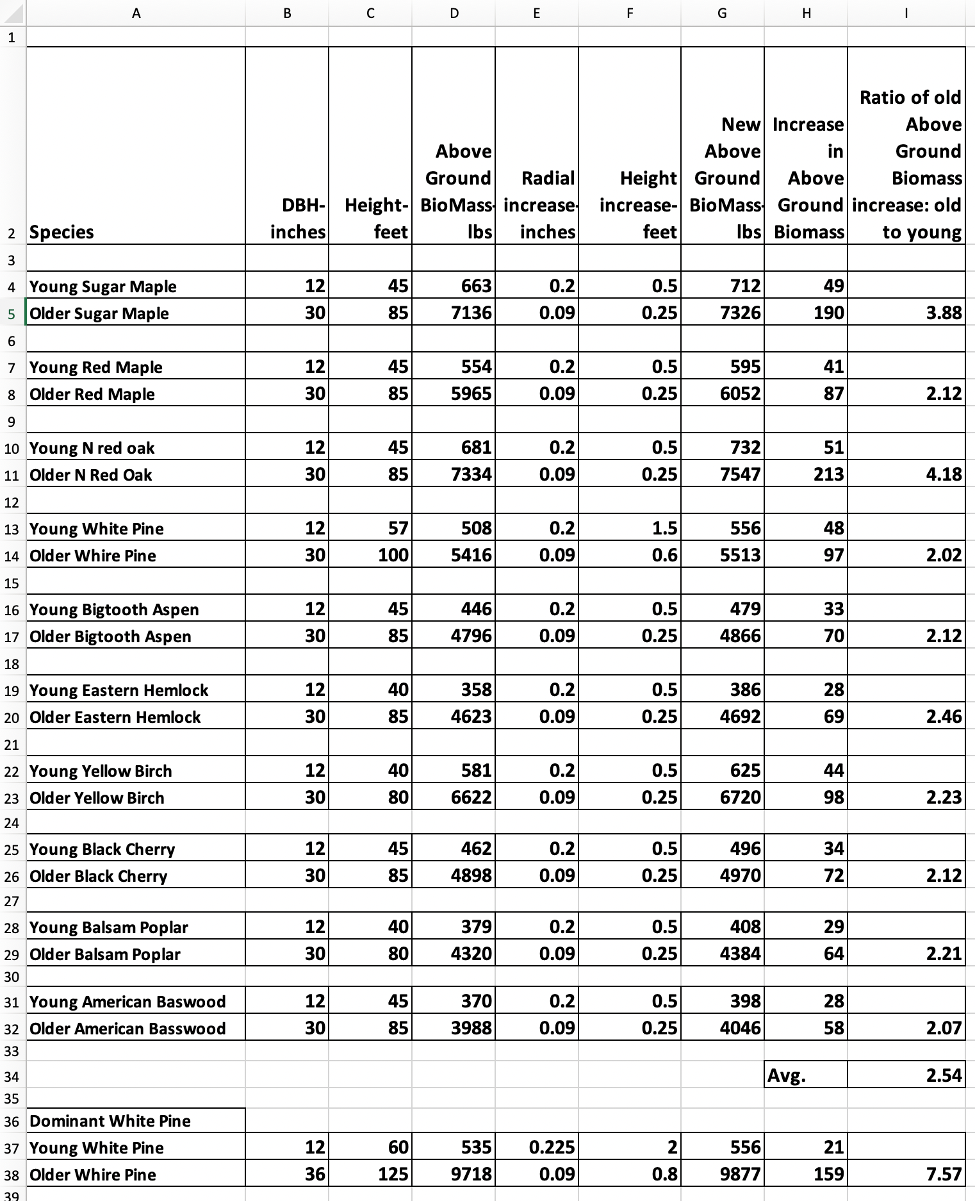
The mature and old-growth forests of the Adirondacks are carbon rich, both above and below ground. They are doing their job with respect to climate mitigation. However, there will always be voices advocating management of public forests to increase carbon sequestration. They typically embrace the arguments for young forests to replace older ones based on the belief that fast-growing, young trees sequester more carbon than older, more slowly growing ones. Using the volume-biomass model, FIACOLE, I evaluated annual growth for ten species of trees. I compared the annual growth of a 12-inch DBH, 40-50-foot tall tree with a tree of the same species at a DBH of 30 inches, and appropriate height for the species. I used an annual radial growth of 0.2 inches and a height gain of 0.5 feet for the young trees. The corresponding increases for the older trees are 0.09 inches radially and 0.25 feet. All species are easily capable of reaching these growth levels. The exception was white pine. It was given annual height increases of 1.5 feet when young, and 0.6 feet when older.
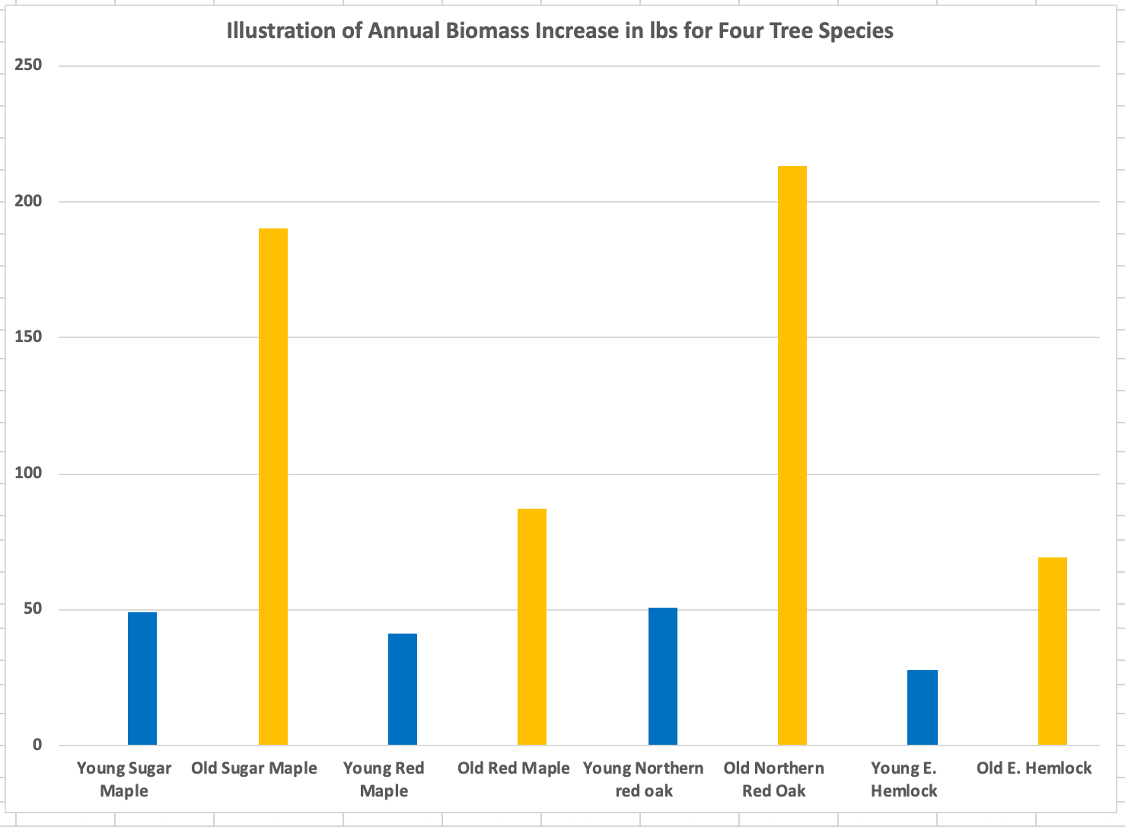
The analysis shows that across the ten species of trees, the annual biomass increase of the older trees averages 2.5 times that of their younger counterparts. The dimensions of the ten species of younger trees for the Adirondack growing environment represent an age of approximately 30 years. The older trees are around 100 years. See Appendix III for the data used. A graphical portrayal of the data for four species is shown below.
Species are sugar maple, red maple, northern red oak, and eastern hemlock. The bars represent annual growth. As an example, the young sugar maple adds 49 lbs of biomass in year 31. It adds 190 lbs in year 101. Therefore, the sugar maple will add 8.8 times as much carbon in year 101 than in year 31. The older maple is 3.3 times the age of the younger maple. If the increase in annual biomass were constant, the amount added in year 101 would also be 3.3 times that added in year 31, but instead it is 8.8 times as much.
From this example, it is difficult to make the argument for substituting young trees for mature ones in terms of each’s annual contribution to the carbon pool. Arguments to do that:
- often invalidly employ percentage-based versus absolute growth
- underestimate the continuing biomass contributions of older trees
- assume thick stands of young, fast-growing trees add carbon in higher amounts than mature ones
- discount on-site above and below-ground carbon losses during and after logging
- over-estimate the amount of the whole tree that makes it into long term storage items such as buildings, furniture, etc., and
- do not properly account for the transfer of above ground live tree carbon into the other pools, e.g. dead wood, litter, below ground sources.
CONCLUSION
The best solution for the use of our public forests in climate mitigation, and I emphasize public, is to implement the concept of Proforestation as developed by William Moomaw, Susan Masino, and Ed Faison to the maximum extent possible. In the Adirondacks where significant acreages are not open to logging, the protection should absolutely remain. On public lands open to logging, exceptions could be made where widespread outbreaks of invasive insects threatened an entire forest or species. But where the forests are in reasonably good shape, Proforestation is a simple, inexpensive strategy: leave mature public forest alone to continue sequestering carbon at high rates without the attendant losses incurred by logging during this period of rapid global warming. This is not to disparage forest management on non-public lands. It is essential for woodlands that supply us with forest products. There is no argument on that point. But during this crucial period of getting our carbon emissions under control, the public forests should basically be left alone to accumulate carbon as rapidly as possible. Where management in public forests is continued, the priority should be to increase the rate of carbon storage beyond what would happen through natural processes. There are management strategies to increase sequestration in forests, but they do not include removing the star performers, the big trees. This is a point that needs continual reinforcement to combat the misunderstanding about the performance of the big trees.
The public part of the Adirondack Reserve has been implementing the concept of Proforestation since 1894. As a consequence, we can see the difference in carbon stores between unmanaged forests and those woodlands within park boundaries that have been continuously managed. The lesson is pretty clear. We don’t gain carbon by removing mature trees.
APPENDIX I: PROFILE OF A LARGE WHITE PINE’S GROWTH OVER 200 YEARS
What follows in the table below is a chronosequencing of the biomass growth of a large white pine in Mohawk Trail State Forest. Radial and height growths are projected as annual averages for nine 20-year intervals. The last one is 40 years. These annual radial and height growth rates allow the calculation of total above ground volume. From there, density is factored in for white pine (22.334 lbs/ft^3) to arrive at biomass. Loss of biomass to decay is then introduced to get net biomass, total and within the period. The final calculations convert to carbon and carbon dioxide sequestered annually during each period. This tree has been climbed with measurements taken aloft. This protocol is called direct measurement. We have climbed many trees and direct measured their trunks. For a sample of 58 pines, direct measurements differed from the aggregate volumes for direct and statistically derived b7yb-1.54%. Averaging the sum of the absolute value differences of direct and statistic measurement leads to an average difference of 4.77%. The statistical model used is FIACOLE. See Appendix II. It is the best of 13 models tested.
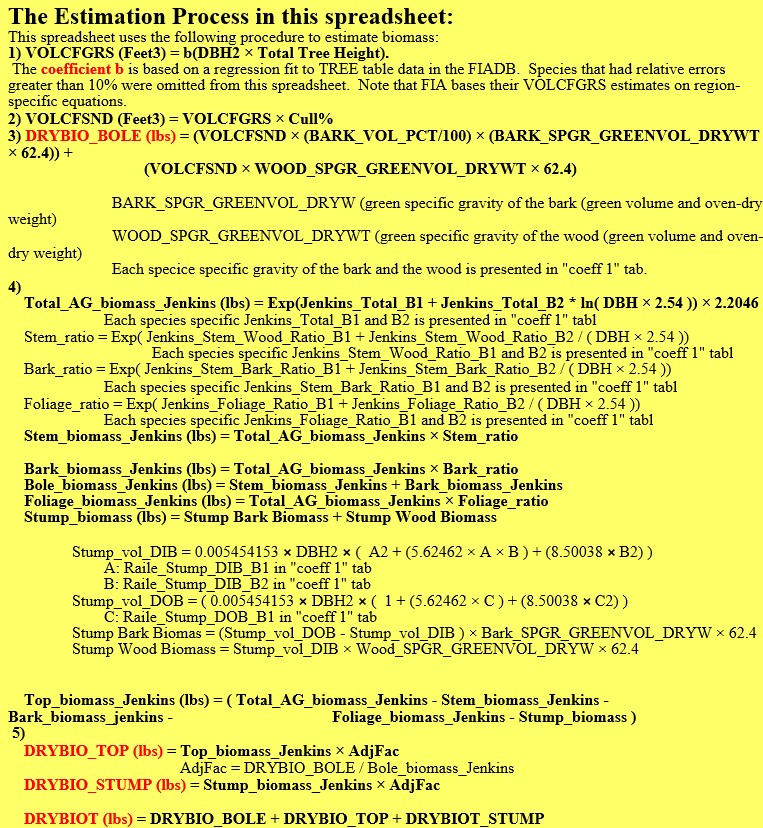
APPENDIX II: FIACOLE VOLUME-BIOMASS MODEL EXPLANATION
The following description is what the developers present to describe their biomass Excel workbook entitled biomSlctSpp.xls. Their explanation is for those familiar with the U.S. Forest Service Forest Inventory and Analysis Program. The original workbook handles 189 species of trees. DBH in inches and total height in feet are given to the BIOMASS worksheet for a tree. The biomass returns in lbs are shown as the last three entries. FIACOLE is my adaptation of the original biomSlctSpp workbook. I regret that the authors of this exceptional value biomass calculator are unknown to me. I have tried to identify them, but with no luck.
APPENDIX III: GROWTH PROFILE OF TEN ADIRONDACK SPECIES CURRENT AND NEXT YEAR
Below is a screen print of an Excel worksheet that computes the annual biomass growth for ten species of trees. Each species is presented for two sizes, small and large. Biomass values come from the FIACOLE system, which is explained in the previous appendix.
Robert T. (Bob) Leverett is a co-founder of the Native Tree Society, principal organizer of the Ancient Eastern Forest Conference Series, and senior advisor to American Forests Champion Tree Program. He is also Chair of the Forest Reserves Science Advisory Committee (Massachusetts Department of Conservation and Recreation). Bob was a regular contributor to the original Wild Earth Publication. He is also a co-author of “The Sierra Club Guide to Ancient Forests of the Northeast.” Today he is heavily involved in measuring trees to quantify their stored carbon and rates of sequestration. He is a coauthor of two scientific papers on the subject, both published. With his wife, classical music pianist Monica Jakuc Leverett, he is working on guides for his forest mecca, Mohawk Trail State Forest in western Massachusetts.