
Mapping for Rewilding – A Healing Nature’s Wounds Perspective
September 13, 2021
By Bob Howard, The Rewilding Institute Board of Directors
Overview
Maps have played an important role in identifying, characterizing, and planning wilderness protection and wildlife habitat conservation for years. What is needed for rewilding and wilderness protection are maps that can be viewed and understood by politicians, agency personnel, and interested citizens.
Maps based on Geographic Information System (GIS) layers have proven particularly useful. Such GIS mapping efforts went into the published Sky Islands Wildlands Network, the New Mexico Highlands Wildlands Network, the Southern Rockies Wildlands Network, and many subsequent land conservation efforts.
Wildness is basically a state of nature where the landscape is shaped only by natural processes, where self-willed organisms are present in natural patterns of abundance, and where natural ecological processes operate free from the impact of humans. Superimposed on the basic landscape are the species of organisms living there – microbial, flora, and fauna – within and intertwined with their habitat. Coherent collections of landscape, species, and habitat are designated as specific ecosystems.
Similarly, wildness exists in aerial and both fresh water and salt water ecosystems.
Introduce humans, and generally wildness is decreased, i.e., Dewilding. One perspective on this is to consider human-caused degradation or loss in ecosystems as Wounds to Nature. The wounds approach was first described in an article in Wild Earth, further described in Dave Foreman’s book Rewilding North America, and detailed on the rewilding.org website.
Rewilding North America described “Seven primary ecological wounds to the land:
- Direct killing of species
- Loss and degradation of ecosystems
- Fragmentation of wildlife habitat
- Loss and disruption of natural processes
- Invasion by exotic species and diseases
- Poisoning of land, air, water, and wildlife
- Global climate change
Each wound has more than one cause, and many of the causes contribute to more than one wound. The overall impact of these wounds is greater than their sum, and they are highly synergistic.”
Rewilding is considered by the book and by The Rewilding Institute (TRI) to include not only the protection and conservation of existing wild areas and wildness, but also whenever possible the healing of the wounds to Nature that humankind has caused. The basic precept of Rewilding is to reverse the impacts of Dewilding through all possible means. Realistically, most urban and much suburban development, most roads, and most other “hard” infrastructure are unlikely to be un-built and rewilded in the next few generations. That is also probably true of much agricultural development and operation, although many agricultural processes can be made more nature-friendly. Ranch and pasture lands are perhaps the most amenable to some degree of rewilding. The greatest potential for rewilding is in protecting and rewilding remaining undeveloped lands to the degree possible. That in turn depends on land ownership and management, and on household and local and state politics.
This article is an attempt to pull together–as a reference document–the understanding gained from previous mapping efforts and apply that knowledge to improve display and communication of ecosystem properties through GIS layers and mapping. It outlines the use of conceptual layers to assess and interpret these ecosystem properties in planning for prioritized restoration of specific landscapes and their biota. It identifies and organizes candidate GIS map layers by wound type and uses discrete metrics for each specific wound wherever possible. The intent is to display geographically the degree of naturalness or wildness of an area, where the ecological wounds are, and ultimately the area’s potential for rewilding, all based on conservation biology and scientific data. Such a map constructed from multiple layers representing specific ecosystem properties augments more common map displays.
A set of 9 GIS maps is envisioned–first of the United States and eventually including Canada and Mexico–with a map for each of the seven wounds (types), a summary map for all wounds collectively, and a final map displaying the potential for rewilding. That final map would adjust the wounds summary map for the degree of reversibility of the wounds or their lack of reversibility. Each map should use a coherent and consistent set of standards for geographical details and color scheme.
- Killing
Direct killing or other removal of individuals of a species by humans through shooting, culling, poisoning, trapping, explosives, relocation, etc., disrupts ecosystem balance. Direct killing of species is particularly relevant to wildlife considered to be pests or predators, as explained below. This includes killing of apex (top-level) predators such as wolf, cougar, and grizzly bear. It also includes second-level apex predators such as coyote, bobcat, and black bear, and foundational species such as prairie dog and beaver. Direct killing of species has also led to reduction, local extirpation, and extinction of non-predator species. Direct killing has been institutionalized and globalized through hunting and fishing seasons, predator control programs, pest control programs, poaching, removal for illegal wildlife trade, and specimen collecting.
Individual apex carnivores cause a significantly greater impact on the ecosystem than do individual prey such as deer or elk. This impact is only partly due to predation, but also due to behavioral changes on the part of other prey and non-prey species. Conservation Biology finds healthier and more complete ecosystems where predators are present in a dynamic balance with prey. Historically, many people were afraid for themselves, their livestock, or their game (such as deer), and considered the carnivores to be pests. Ranchers, hunters, and the U.S. Government “Wildlife Services” agency have killed large numbers of carnivores and other species foundational to the local ecosystem such as prairie dogs and beaver. Regarding hunting, most of the predator species killed are not considered edible and are killed for “sport,” and even edible deer, elk, etc., are often killed for “trophy” heads and not eaten.
Killing must be assessed species by species, and even then can probably provide only an approximate measure of the disruption to the ecosystem. A list of species relevant to each ecosystem or area must be developed. Reliable and accurate data, in a usable format, must be obtained and is often not available.
Specific metrics for GIS might be State-level (and even County-level if available) data on known or estimated species population, individual species kill, and a calculated kill/population ratio, for each of the ecologically top-level carnivores or species of special significance. The candidate list of species below shows the common name (and alternate common names in parentheses) followed by the scientific, taxonomic name of Genus and species:
- Cougar (Puma, Mountain Lion, Panther, Catamount) (Puma concolor)
- Bobcat (Lynx rufus)
- Gray Wolf (Canis lupus)
- Mexican Wolf (Lobo) (Canis lupus baileyi)
- Coyote (Czanis latrans)
- Grizzly Bear (North American Brown Bear) (Ursus arctus horribilis)
- Black Bear (Ursus americanus)
- Foxes (Vulpes spp.)
- Beaver (Castor caualensis)
- Prairie Dogs (Cynomys spp.)
- Black-Footed Ferret (Mustela nigripes)
- Bison (Bison bison)
- Trout (Oncorhynchus spp.)
- American Eel (Anguilla chrysatos)
- Salmon (Salmo spp.)
- Bald Eagle (Halliaectus leucocephalis)
- Golden Eagle (Aquilla chrysatos canadensis)
- Fisher (Pekania pennauti)
- Moose (Alces alces)
- River Otter (Lontra canadensis)
- Peregrine Falcon (Falco peregrinus)
- Canadian Lynx (Lynx canadensis)
- Ocelot (Leopardus pardialis)
- Jaguar (Panthera onca)
- Northern Harrier (was the Marsh Hawk) (Circus cyaneus)
Each metric for which data is available would be assigned to its own GIS layer. The set of metrics/layers represents the cumulative killing and removal of wildlife. The set of species selected for a particular area depends on the natural history and characteristics of that area. Note that GIS data layers for other focal and important species may be added and used to display species extirpation and to serve as metrics for wildness.
An overall Killing Index by state should be calculated and included. Such an index would enable the map to display semi-quantitatively where the ecological wounds from Killing are located.
The “Wildlife Kills by County” map below is an example from late 2011 for the 11 western states–probably the most detailed such mapping of its kind at the time. It represents only the kills of cougar, coyote, fox, black bear, grizzly bear, etc., recorded by the U.S. “Wildlife Services” agency, and does not reflect the kills by hunters or poachers. Map courtesy of Kurt Menke. The poor availability of complete, geolocated, digitally compatible data on wildlife kills is a significant obstacle to creating these layers.

- Ecosystem Degradation/Loss
Loss and degradation of ecosystems is the major contributor to Dewilding, resulting from human in-migration, settlement, and development of previously mostly wild landscapes. Degradation and/or loss of the quantity (acreage) and quality of ecosystems appears to occur universally as a function of human population presence and density.
Most ecosystem degradation and loss are due to physical, architectural changes to the landscape, but some are due to other factors. Examples of other factors include: even designated Wilderness and other Protected Area ecosystems may be degraded by trail use, hunting regulations, exotic species invasion, toxic clouds from relatively nearby activities, upstream pollution, and climate change.
Physical, architectural changes causing ecosystem degradation and loss include:
- Agricultural development–including clearing, shaping, tilling, and plowing.
- Clearing of land–cutting of trees, chaining of brush, burning of grassland–causes drastic initial loss and degradation of ecosystems, reduction of biomass, and loss and simplification of natural processes.
- Shaping of land–contouring, terracing, wetland infill, hilltop removal–making land flatter–causes more disruption and simplification.
- Tilling of land–plowing, tilling, harrowing–causes further soil disruption and simplification of natural processes, and erosion loss of soil.
- Timber harvest–both selective and clear-cut–causes major degradation and loss of forest ecosystems.
- Mining activities–from exploration through development and production to waste disposal, and whether of metals or minerals or fossil fuels–causes large losses of landscape ecosystems.
- Creation of roads–especially gravel-, asphalt-, or cement-surfaced roads and parking lots; also mowed grass medians and shoulders and right-of-ways–causes loss of ecosystem landscape area.
- Urban development–residential, commercial, manufacturing, and governmental buildings–usually with cement foundations and often containing steel–all encroach on, degrade, and often permanently destroy ecosystems.
- Suburban development–causes similar changes as urban areas in many ways, although suburban residential lots may have a smaller proportion of building footprint they mostly have large areas of mowed grass–yielding yet more loss of ecosystem landscape area.
The series of landscape changes outlined above also contribute to wounds 3 and 4.
Specific metrics for ecosystem degradation and loss might include:
- Human population distribution and density
- Urban/municipal areas
- Industrial and commercial developments
- Residential developments, suburbs, exurbs
- Roads, canals, electrical transmission lines, railroads, and their right-of-ways
- Farmed/tilled lands (croplands)
- Livestock grazing lands
- Timber harvest areas
- Mining, mining spoil, and mining waste areas
- Coal, oil, and natural gas exploration, production, and storage/transport areas
- Locks, dams, water diversions, canals
- Fire, human-caused, whether accidental or intentional
- Perhaps even less obvious changes such as channelization, weirs, and catchment basins
- Loss of flyway stopover and staging areas
Each metric for which data is available, along with its weighting, would be assigned to its own GIS layer. The set of metrics/layers would represent cumulative ecosystem degradation and loss.
These metrics essentially describe what goes into most human footprint models, which are quite labor-intensive. Existing Human Footprint data can be used for now. See the example Human Footprint map below, courtesy of Kurt Menke.
Research on ecosystem degradation and loss metrics has probably been conducted, and should be incorporated into this program insofar as possible.
An overall Ecosystem Health Index by state and even by county would be helpful if one can be found/developed. Such an index would enable the map to display semi-quantitatively where the ecological wounds from Ecosystem Degradation/Loss are located.
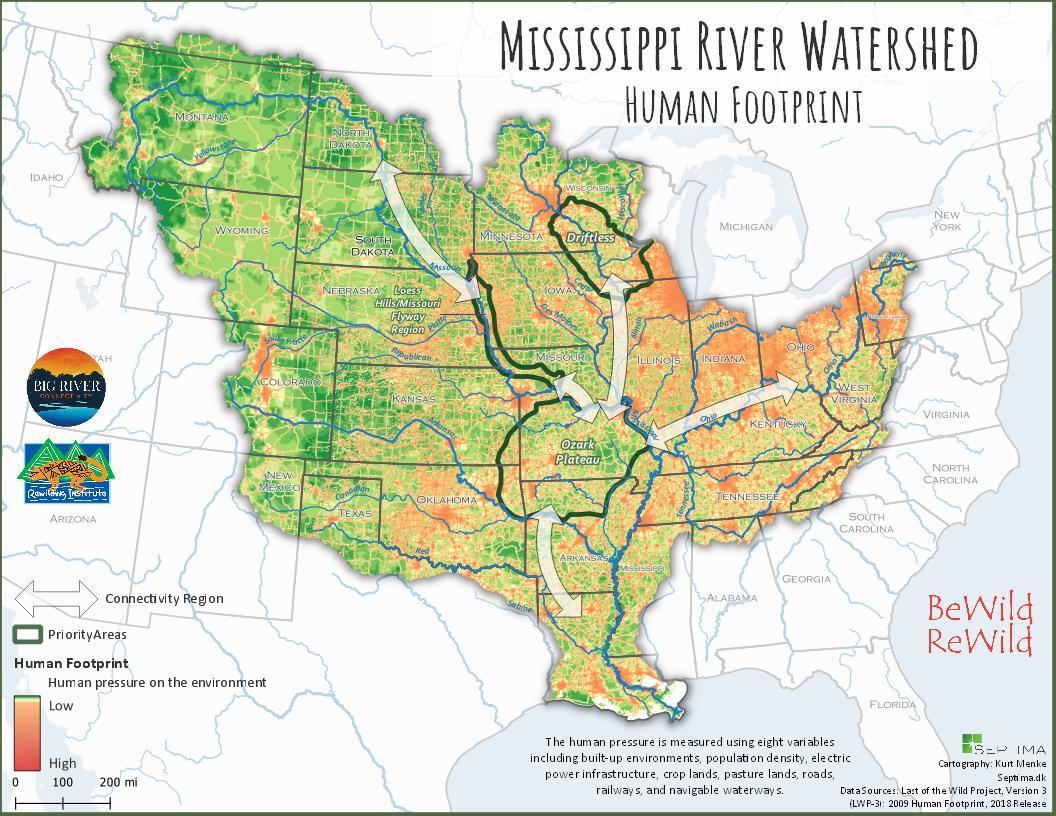
Human Footprint

This draft map was developed as part of the BIG RIVER CONNECTIVITY Vision, for a wilder, more beautiful, more biologically diverse, and a more enduring Mississippi River Watershed. Project collaboration between BeWildReWild, The E.O. Wilson Biodiversity Foundation, Project Coyote, and The Rewilding Institute.
- Habitat Fragmentation
Fragmentation of wildlife habitat usually is caused by specific barriers to movement of a particular species such as fences, walls, trails, roads, cleared areas, right-of-ways, railroads, developed areas with buildings and pavement, canals, locks and dams, and some larger human-constructed waterbodies. The movements needed by the species may be for local foraging or access to water, for time-of-day movement, for denning and reproduction, induced by drought or flood, or be seasonal.
Specific metrics of habitat fragmentation might include:
- Fences
- Walls
- Trails
- Cleared Areas
- Croplands
- Pipelines and their right-of-ways
- Electrical Transmission Lines and their right-of-ways
- Roads, Highways, and Interstate Highways, and their right-of-ways
- Railroads and their right-of-ways
- Developed, built and/or paved areas
- Canals
- Locks and dams
- Larger human-constructed or human-modified waterbodies
Each metric for which data is available, along with its weighting, should be assigned to its own GIS layer. The set of metrics/layers would represent cumulative habitat fragmentation and loss.
An overall Habitat Fragmentation Index by state and even by county would be helpful if one can be found/developed. Such an index would enable the map to display semi-quantitatively where the ecological wounds from Habitat Fragmentation are located.
This also is basically a human footprint type of analysis with a different set of input metrics and weightings. See the example Human Footprint map. A surrogate analysis likely exists from the work of Mark Anderson at The Nature Conservancy or similar analysis. Note that the boundaries of Wilderness and other Protected Areas are often shown alongside the fragmentation metrics to provide perspective.
- Natural Process Degradation/Loss
Disruption and loss of natural processes are difficult to assess because ecosystem processes frequently can only be inferred indirectly, not measured directly. Examples range from failure of river delta formation due to damming of large rivers, through widespread loss of water cleaning and oxygenation due to wetlands infill, through more local barriers to seasonal elk or pronghorn migration posed by a busy Interstate Highway, to the ultra-local interruption of mycorrhizal filament nutrient transport due to plowing or tilling.
This suggests that specific or overall index metrics for natural process degradation and/or loss per se may simply not be available. At best, natural process degradation or loss may be inferred from killing, fragmentation, poisoning, and climate change layers weighed differently. For instance, released meso-predators may be inferred from low or absent top carnivores, altered riparian/grassland/forest land balance inferred in the absence of beaver, and altered grassland health and diversity inferred from loss of prairie dogs. Data from the agricultural census may be useful combined with land use, land cover, recent abnormal wildfire perimeters, and areas lacking top carnivores. Each metric for which data is available, along with its weighting, should be assigned to its own GIS layer. The set of metrics/layers would represent cumulative natural process degradation and loss.
An overall Natural Process Index by state and even by county would be very helpful if one can be found or developed. This also is basically a human footprint type of analysis with a different set of input metrics and weightings. See the example Human Footprint map. Such an index would enable the map to display semi-quantitatively where the ecological wounds from Natural Process Degradation/Loss are located.
- Exotic Species Invasion
An exotic (alien) species is usually identified as an individual of a species not natively present in the local ecosystem. Some exotic species (and sometimes even native species) exhibit behavior that provides a competitive advantage over endogenous species that markedly alters the native ecosystem. Invasion by exotic or non-native species (and sometimes even native species) may occur from local-level to ecosystem-wide-level and cause wide and serious disruption of natural processes and loss of native species. Excellent exotic species information online includes invasive.org and invasivespeciesinfo.gov/us, and eddmaps.org The latter is a great resource and all the data are downloadable! This could all therefore be combined to create an Exotic Species Invasion Index for extensive data and maps on distribution, sightings, and treatment in North America.
Exotic and invasive species number in the thousands. The species listed below have been identified as particularly widespread and/or troublesome in ecosystems.
Specific metrics for Exotic Species Invasion layers might include:
Plants —
- Salt cedar (tamarix spp.)
- Russian olive (elaeagnus angustifolia)
- Russian knapweed (acroptilon repens)
- Dalmatian toadflax (linaria dalmatica)
- African rue (peganum harmola)
- Kudzu vine (pueraria montana var. lobata)
- Cheatgrass (bromus tectorum)
- Garlic mustard (allaria petiolata)
- Leafy spurge (euphorbia esula)
- Japanese knotweed (polygonum cuspidatum)
- Crown vetch (cronilla varia)
- Japanese stiltgrass (microstegium vimineum)
- Tree-of-heaven (ailanthus altissima)
- Reed canary grass (phalaris arundinacea)
- Purple loosestrife (lythrum salicaria)
- Multiflora rose (rosa multiflora)
- Other invasive plants
Insects —
- Emerald ash borer (agrilus planipennis)
- Hemlock wool adelgid (adelges tsugae)
- Sirex woodwasp (sirex noctilio)
- Malaria Mosquito (Anopheles spp., especially A. quadrimaculatus)
- Other invasive insects
Invertebrates —
- Zebra mussel (dreissena polymorpha)
- Quagga mussel (dreissena bugensis)
- Asian clam (corbicula fluminea)
- Other invasive invertebrates
Vertebrates —
- Lionfish (pterosis volitans)
- Northern snakehead (channa argus)
- Asian carp (multiple species)
- Feral swine (sus scrofa)
- Burmese python (python molurus ssp. bivittatus)
- Other invasive vertebrates
Livestock Grazing —
- Cattle, sheep, and other grazing livestock should also be considered in this category, as their effect on otherwise undeveloped land is ecologically similar to that of highly invasive species.
Birds –
- European starling (stumus vulgaris)
- Other invasive birds
Fungi —
- White-nose syndrome fungus in bats (Pseudogymnoascus destructans)
- Other invasive fungi
Bacteria —
- Invasive bacteria
Virus —
- Invasive virus
Each metric for which data is available, along with its weighting, would be assigned to its own GIS layer. The set of metrics/layers would represent cumulative exotic species invasion.
An overall Exotic Species Invasion Index by state and by county would be helpful if one can be found or developed. Such an index would enable the map to display semi-quantitatively where the ecological wounds from Exotic Species Invasion are located.
- Poisoning
Poisoning of land, air, water, and wildlife can cause widespread disruption of natural processes up to and including failure of ecosystem functions and death of organisms. Poisoning and pollution has become extremely widespread due to the modern industrial economy and culture. Examples include acid rain plumes; wildfire smoke; agricultural nitrogen and phosphate fertilizer application, glyphosate application, insecticide and rodenticide use; wastewater discharge by oil and gas, mining or industrial activities; municipal sewage discharge; landfill or trash dump runoff; and use of lead ammunition remains a threat to wildlife who consume carrion. Often the source agent, material, or chemical is further converted by natural processes to become a family of poisons, sometimes more damaging than the original.
Specific metrics for poisoning might include:
- Acid rain
- Smoke
- Agricultural nitrogen
- Agricultural phosphate
- Glyphosate (Roundup®)
- Insecticides
- Fungicides
- Herbicides
- Rodenticides
- Municipal sewage discharge
- Other wastewater discharge
- Agricultural wastes
- Mining wastes
- Industrial wastes
- Municipal solid wastes
- Plastics
- Lead bullets and shot
Each metric for which data is available, along with its weighting, should be assigned to its own GIS layer. The set of metrics/layers would represent cumulative poisoning.
An overall Poisoning Index by state and by county would be helpful if one can be found/developed. Such an index would enable the map to display semi-quantitatively where the ecological wounds from Poisoning are located.
- Climate Change
Global climate change is expected to bring long term changes with higher temperatures, less rainfall and snowfall, and more intense storm activity. Changes in the Jet Stream will affect both weather and climate. Sea level is expected to increase. Drought is expected to be both more widespread and more intense. Adaptive strategy for organisms generally is expected to be to migrate further North, to Northern or Northeastern slopes, and higher in elevation if possible. Atmospheric, oceanic, and terrestrial carbon dioxide levels have increased greatly and are expected to continue to increase.
Specific metrics for global climate change might include:
- Temperature
- Precipitation–rainfall and snowfall amounts
- Storm Intensity
- Jet Stream patterns
- Sea level changes
- Drought
- Atmospheric Carbon Dioxide
Research on global climate change has been conducted extensively, and that data should be used and an overall Climate Change Index created in Wounds GIS layers work. Each metric for which data is available, along with its weighting, would be assigned to its own GIS layer. The set of metrics/layers would represent cumulative ecosystem degradation and loss due to global climate change.
An excellent analysis exists in the Resilient Lands work of The Nature Conservancy. Such an index would enable the map to display semi-quantitatively where the ecological wounds from Climate Change are located.
Overall Ecological Wound Index
Depending on the index units for evaluating each wound, it should be possible to develop an overall Ecological Wound Index, again by state and even by county. Such an index would enable the map to display semi-quantitatively where the ecological wounds are, and how severe those wounds are, as well as suggesting the degree of naturalness or wildness of the land based on conservation biology and scientific data. Such an overall ecological wounds map would be particularly useful in conjunction with more typical Wildlands Network Design maps displaying topography, land ownership, administrative authority and responsibility, designated land use, etc.
Overall Rewilding Potential Index
An important consideration for rewilding is the potential reversibility or “healing” of the wounds, whether by natural processes alone or in conjunction with human intervention and restoration efforts.
Many grazing lands are otherwise minimally disturbed, with only a few fences, dirt roads, or built structures in addition to the grazing impacts, and hold high potential for rewilding.
Many agricultural croplands will have been cleared, shaped, plowed, tilled, planted, and harvested over time. But so long as they have not been overly eroded or depleted, and not poisoned, they may hold significant potential for restoration and some degree of rewilding.
In contrast, more permanent wounds from mining and mine wastes, Interstate Highways, concrete and steel structures of urban and residential and commercial and industrial development, may present major and long-term obstacles to rewilding on any human time scale.
Recall that the overall intent here is to display geographically the degree of naturalness or wildness of the land, where the ecological wounds are, how severe they are, and the land’s potential for rewilding, all based on conservation biology and scientific data. Depending on the index units and a reversibility assessment for evaluating each specific wound, it may be possible to develop an overall Rewilding Potential Index, which would adjust the specific wounds data for reversibility, again by state and by county. Analysis for rewilding potential should include demographic information, such as human population data and trends. A Rewilding Potential Index would enable the map to display semi-quantitatively where the highest potential for rewilding exists, based on conservation biology and scientific data. An overall rewilding potential map would be particularly useful in conjunction with and augmenting more typical Wildlands Network Design maps displaying topography, land ownership, administrative authority and responsibility, designated land use, etc.
The organization of GIS map layers and summary maps by wound type, with specific and cumulative wound data and the derived indices, would show where rewilding is most possible according to the map models, and where rewilding is probably beyond practical reach. It would provide an important addition to our ability to decide rewilding’s where questions.
Mitigation measures for the general wound types and for specific wounds should be collected and assessed in a separate document.
This document is intended to be further refined and extended.

Bob (Robert E.) Howard, M.D., Ph.D., is a retired medical school professor, retired consultant, and 50- year environmental activist. He was on the medical faculty at Washington University (St. Louis), University of Colorado (Denver), University of Texas Medical Center at San Antonio, and University of New Mexico (Albuquerque). His medical computing consulting clients ranged from Connecticut to San Francisco Bay. He held many and varied leadership positions in the Sierra Club, at local, state, regional, national, and international levels.
Perhaps the most important were serving as Vice President for Planning for over a decade, and serving on the national Board of Directors for four years as Vice President (with conservation oversight) and two years as Treasurer. At home in New Mexico he worked primarily on Wilderness designation and protection.
Bob worked with Dave Foreman and Dave Parsons in the initial founding of The Rewilding Institute in 2003, and as a Conservation Fellow. Bob speaks and writes on conservation policy, wilderness and natural systems protection, biodiversity, and habitat connectivity.
Bob was one of the founders of the New Mexico Wilderness Alliance in 1997, served as Chairman the first four years, and on the Board of Directors for ten years. Bob also served as President of the Wildlands Project and on it’s Board of Directors. He has worked directly or consulted on about a dozen wildland network designs.